Chapter 7 Asset Cases Part II
Chapter 7 Asset Cases Part II
This article continues the review of chapter 7 asset cases that we began in the December/January 2003 issue.2 In the earlier article, we reported that about 4 percent of all chapter 7 cases included non-exempt assets which, for the 12 months ending June 30, 2002, resulted in $825 million being returned to pre-petition creditors. Further, we showed that a very large proportion of these funds are collected from a very small proportion of the asset cases. In fact, more than 86 percent of all disbursements arose from only 10 percent of the cases. In this article, we examine more closely the large proportion of small-dollar asset cases. We define these "small-asset cases" to be those with less than $10,000 in collections and distributions.
Administration of Small-asset Cases
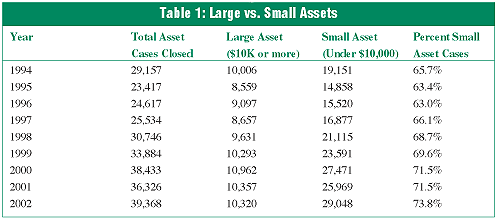
The number of small-asset cases that are administered is growing. As Table 1 illustrates, the number of larger asset cases closed each year has remained fairly constant since the mid 1990s, while the volume of smaller asset cases closed has nearly doubled. In 2002, small-asset cases were nearly three-quarters of all asset cases closed.

Money in Small-asset Cases
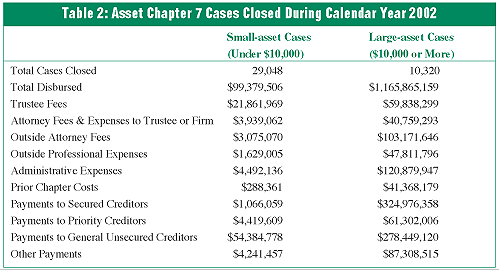
The total amount of money handled in the small-asset cases was just under $100 million in 2002. This compares with the more than $1.1 billion that was handled in the larger-asset cases, and the more than $4 billion that was disbursed in chapter 13 cases during the year. Table 2 compares the small-asset cases with the larger ($10,000 and above) asset cases.

The majority of all money collected is paid to general unsecured creditors. In 2002, nearly 55 percent of the money disbursed in small-asset cases was paid to general unsecured creditors, compared to less than 24 percent of funds in the larger-asset cases. Ninety percent of the small-asset cases included at least some payments to general unsecured creditors.
Trustee fees are proportionally high in the small-asset cases under the statutory scheme. Section 326(a) of the Code allows a trustee fee of up to 25 percent of the first $5,000 distributed, and 10 percent for distributions between $5,000 and $50,000. Thus, in a case with $3,000 in distributions, a trustee may be awarded up to $750, and in a case with $10,000 in distributions, the maximum fee is $1,750. The court allowed the maximum fee in approximately 92 percent of the small-asset cases closed during 2002.
Only about seven percent of total payments in the small-asset cases were for attorney fees. In fact, more than three quarters of the cases had no post-petition attorney fees at all. In the cases where attorney fees were reported, they amounted to an average of 22.2 percent of total receipts. In about 70 percent of the cases with attorney fees, the attorney was actually the case trustee of his/her firm rather than outside counsel. In the larger-asset cases, attorney fees were reported in 73.4 percent of the cases closed, and these payments accounted for 12.2 percent of total payments.
What is being liquidated in these cases? Right now, the anecdotal data is that the assets are often tax refunds and non-exempt equity in autos. The U.S. Trustee Program, chapter 7 trustees and the trustees' software providers have implemented a new reporting system that will provide an answer to this question in the near future.
Using the new Form 4 data collection tool described in the prior article, we can begin to delve further into the analysis of the small-asset cases. Chapter 7 trustees provided Form 4 data for 26,828 of the small-asset cases closed in 2002, and 92 percent of these cases distributed something to the unsecured creditors. These 24,350 cases generated $82 million in funds available for distribution, of which $50.5 million (62 percent) went to general unsecured creditors, an average of almost $2,100 per case. The average amount of allowed unsecured claims in these cases, $30,300, means that these creditors, on average, recovered 6.8 percent as a result of the chapter 7 trustee's efforts.
State-by-state Variation
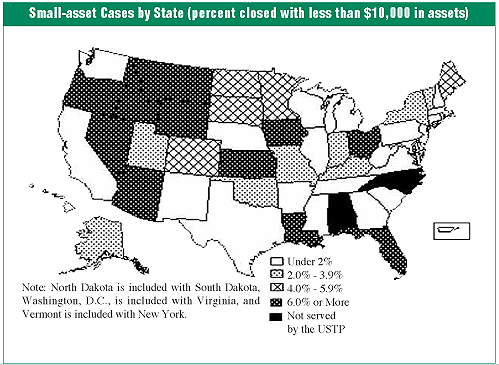
In our prior article, we noted that there was a wide variation in the percentage of asset cases by state. Closer examination of the data shows that most of this variation is due to the number of small-asset cases closed in each state. In some states, small cases are routinely administered, while in others they are almost never administered. For example, a chapter 7 case filed in Louisiana is nearly 50 times more likely to be closed as a small-asset case than is a chapter 7 case filed in Mississippi. We surmise that such a dramatic difference in outcomes is not fully attributable to state exemptions and different debtor circumstances in the two states. The map at right shows the percentage of chapter 7 cases closed as asset cases in each state.3
Five states accounted for nearly one-half of the small-asset cases closed (Florida (4,365), Ohio (3,305), Arizona (2,167), Nevada (1,803) and Louisiana (1,637)). These same five states accounted for just under 20 percent of the larger-asset cases closed (2,029 of 10,320) and less than 16 percent of all chapter 7 case filings. At the other extreme were six states that each had less than 30 small-asset cases closed during the year (Delaware (5), New Mexico (12), New Hampshire (19), Rhode Island (26), Hawaii (28) and Mississippi (29)).

Intrastate Variation
It is plausible to believe that differences in state exemption laws may account for some of the variability in the administration of small chapter 7 cases. On the other hand, there is such wide variation within many states that exemption law differences cannot possibly explain all of the variation. For example, the proportion of small-asset cases in the Eastern District of California is more than 10 times as high as in the Central and Southern Districts of California. In general, the proportion of small-asset cases seems to be higher in the less-urban portions of a given state. Here are a few examples that show substantial intrastate variation based on cases closed during 2002.
Percent Closed as Small-asset Cases
California
Eastern District—2.24%
Northern District—.87%
Southern District—.13%
Central District—.09%
Florida
Northern District—15.7%
Middle District—9.3%
Southern District—3.1%
Indiana
Northern District—4.4%
Southern District—1.2%
Missouri
Western District—5.4%
Eastern District—2.6%
Michigan
Western District—3.1%
Eastern District—1.0%
Differences by Trustee
There are about 1,220 active panel trustees serving nationwide. For the year, this works out to about 24 small-asset cases closed per trustee. However, our records show that 12 trustees closed more than 200 small-asset cases during the year—accounting for more than 10 percent of the national total. Additionally, 21 other high-volume trustees closed at least 125 small-asset cases during the year. At virtually every location, one or two trustees closed far more small-asset cases than other trustees serving at the same location with similar case draws.
Conclusion
Most chapter 7 asset cases involve relatively small amounts of money. A substantial proportion of the money in these small-asset cases is paid to general unsecured creditors—a far higher percentage than in the larger chapter 7 asset cases or in chapter 13 cases. Whether or not a chapter 7 case results in collection and payment of funds by the trustee is often a function of where the case is filed, and which trustee from the panel is assigned to the case.
Footnotes
1 All views expressed in this article are those of the authors and do not necessarily represent the views of the Executive Office for U.S. Trustees or the Department of Justice. Return to article
2 Flynn, Ed, Bermant, Gordon, and Hazard, Suzanne, "Chapter 7 Asset Cases," 21 Amer. Bnkry. Inst. J. (December/January 2003). Return to article
3 Most small-asset cases are between one and three years old at the time of closing. To estimate the percentage for each state, we divided the number of small-asset cases closed in 2002 by average filings in the state during 2000 and 2001. Return to article
